
Probability
Textbook Exercises & Solutions
Think first. Use AI purposefully. Verify always.
Choose Try It Yourself to develop your reasoning, or View Solution to read the complete solution straight away.
Starred textbook questions are collected separately in ★ AIMS Think+.
Exercise Set 7.1 — Question 1
Printed page 159
Rank the following events on a scale from 0 (Impossible) to 1 (Certain). Label each event: Impossible, less likely, equally likely (even chance), more likely, certain. Give reasons why you gave each event its ranking.
(i) The next Monday will come after Sunday.
(ii) It will snow in Mumbai in July.
(iii) An elephant will walk through your classroom today.
(iv) You will greet at least one friend at school tomorrow.
AIMS worked solution
Given
Rank and explain: (i) next Monday comes after Sunday; (ii) snow in Mumbai in July; (iii) an elephant walks through your classroom today; (iv) greeting at least one friend at school tomorrow.
To Find
Qualitative likelihoods on the impossible-to-certain scale
Reasoning
Contextual likelihood is not a measured numerical probability.
Solution
(i) Certain, 1: this follows from the defined order of weekdays.
(ii) Extremely unlikely in Mumbai’s ordinary July climate
no measured probability is supplied, so do not manufacture one or infer logical impossibility merely from rarity.
(iii) Extremely unlikely in an ordinary classroom
the answer depends on the situation.
It is not a logical impossibility in every imaginable setting.
(iv) More likely if tomorrow is a normal school day and friends attend
holidays, absence and other circumstances can change the judgement.
Result
Certain for (i); contextual, reasoned judgements for (ii)–(iv). No exact probabilities are justified for those three.
Compare the reasoning with your own work. Reading a solution does not record mastery.
Exercise Set 7.2 — Question 1
Printed page 165
A teacher mixes a large bag of sweets of different colours and randomly selects a sample of 30 sweets. She counts the number of sweets of each colour: 10 red sweets | 8 green sweets | 7 yellow sweets | 5 blue sweets
(i) Calculate the probability that a randomly picked sweet from the sample is green.
(ii) If there are 600 sweets in total in the large bag, estimate how many are likely to be yellow, based on the sample results.
AIMS worked solution
Given
A random sample of 30 sweets contains 10 red, 8 green, 7 yellow and 5 blue. (i) Find P(green) when selecting from this sample. (ii) Estimate yellow sweets in a bag of 600.
To Find
Sample probability and population estimate
Reasoning
Uniform selection from the sample; sample proportion used as an estimate for the bag.
Solution
(i) P(green) = = .
(ii) Estimated yellow count = 600 × = 140.
A sample estimate need not equal the actual bag count.
Result
(i) . (ii) An estimated 140 yellow sweets.
Compare the reasoning with your own work. Reading a solution does not record mastery.
Exercise Set 7.2 — Question 2
Printed page 165
A survey is conducted at a school where a random sample of 40 students is asked about their favourite club. The responses are: 14 students: Science Club | 11 students: Arts Club | 9 students: Sports Club | 6 students: Debate Club Assume there are 800 students in the whole school.
(i) What is the probability that a randomly chosen student from the sample prefers the Arts Club?
(ii) Using the sample results, estimate how many students in the whole school are likely to prefer the Sports Club.
AIMS worked solution
Given
Among 40 sampled students, 14 prefer Science, 11 Arts, 9 Sports and 6 Debate. The school has 800 students. Find sample P(Arts) and estimate the whole-school Sports count.
To Find
Arts sample probability and estimated Sports count
Reasoning
Use the sampled proportion, keeping estimate and actual count distinct.
Solution
P(Arts) = .
Estimated Sports count = 800 × = 180.
Result
; an estimated 180 students.
Compare the reasoning with your own work. Reading a solution does not record mastery.
Exercise Set 7.2 — Question 3
Printed page 165
Toss a coin 20 times and record the result each time (heads or tails).
(i) How many times did you get heads?
(ii) How many times did you get tails?
(iii) Calculate the experimental probability of getting heads.
(iv) If you toss the coin once more, what is the probability of getting tails?
AIMS worked solution
Given
Toss a coin 20 times. Record heads and tails, calculate experimental P(heads), and consider P(tails) on the next toss.
To Find
Observed counts, relative frequency and next-toss model
Reasoning
Experimental probabilities use actual observations; theoretical probabilities need a model.
Solution
Let the recorded head count be h.
Then the tail count is 20−h.
Enter your actual counts
there is no predetermined observation.
Experimental P(heads) = .
If the coin is fair and tosses are independent, the next-toss P(tails) = , regardless of previous counts.
Without that model, the 20 observations alone do not establish an exact next-toss probability.
Result
Head count h, tail count 20−h, observed head proportion ; next-tail probability under the fair-independent model.
Compare the reasoning with your own work. Reading a solution does not record mastery.
Exercise Set 7.2 — Question 4
Printed page 165
Toss a paper cup into the air 100 times. After each toss record whether the cup lands on its bottom, upside down on its top or on its side (See Fig. 7.5). Assign probabilities to the outcomes by using experimental probability.
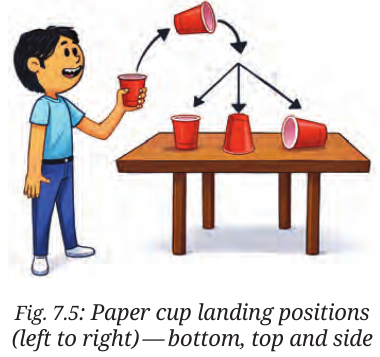
AIMS worked solution
Given
Toss a paper cup 100 times and record bottom, top and side landings. Assign experimental probabilities.
To Find
Three observed landing proportions
Reasoning
Relative frequency = observed count / total trials.
Solution
Let b,t,s be your recorded counts.
Check b+t+s = 100.
Assign , and to bottom, top and side respectively.
These estimates add to 1.
Three named outcomes do not imply probabilities of : the cup’s shapes and landing dynamics differ.
Result
Use your actual , and ; no landing counts are fabricated.
Compare the reasoning with your own work. Reading a solution does not record mastery.
Exercise Set 7.2 — Question 5
Printed page 165
What is the probability of getting an even number when rolling a fair 6-sided die?
AIMS worked solution
Given
Find P(an even number) for a fair six-sided die.
To Find
Probability of an even outcome
Reasoning
Each of six faces is equally likely.
Solution
S = {1,2,3,4,5,6}
E = {2,4,6}.
P(E) = = .
Result
.
Compare the reasoning with your own work. Reading a solution does not record mastery.
Exercise Set 7.2 — Question 6
Printed page 166
Suppose you roll a 6-sided die 12 times and get a ‘3’ three times.
(i) What is the experimental probability of rolling a ‘3’?
(ii) What is the theoretical probability of rolling a ‘3’?
(iii) Why might these probabilities be different? What would you expect to happen if you roll the die 60, 600, or 6000 times?
AIMS worked solution
Given
A die shows 3 in three of 12 rolls. Find experimental and theoretical P(3), explain the difference, and discuss 60, 600 and 6000 rolls.
To Find
Observed proportion, theoretical probability and long-run interpretation
Reasoning
Relative frequency and the fair-die theoretical model are different quantities.
Solution
Observed P(3) = = .
Under a fair-die model, theoretical P(3) = .
Random variation makes a small sample differ from the model probability.
For 60, 600 and 6000 independent fair rolls, the expected counts are 10, 100 and 1000
these are not guaranteed counts.
Relative frequency tends to stabilise near over many trials.
It need not equal exactly or move closer after every added roll.
Result
Observed ; theoretical if fair; longer runs typically give a more stable relative frequency, not exact equality.
Compare the reasoning with your own work. Reading a solution does not record mastery.
Exercise Set 7.3 — Question 1
Printed page 167
When a single 6-sided die is rolled, what is the total number of possible outcomes in the sample space?
AIMS worked solution
Given
How many outcomes are in the sample space of one six-sided die roll?
To Find
Sample-space size
Reasoning
List each possible face once.
Solution
S = {1,2,3,4,5,6}, so n(S) = 6.
Result
6.
Compare the reasoning with your own work. Reading a solution does not record mastery.
Exercise Set 7.3 — Question 2
Printed page 167
For the following experiments write down the sample space S.
(i) Rolling a die and tossing a coin together.
(ii) Choosing a random integer between – 5 and + 5.
(iii) A box containing 5 green and 7 red balls. One ball is drawn at random.
AIMS worked solution
Given
Write S for (i) a die and coin together, (ii) a random integer between −5 and +5, (iii) drawing one ball from 5 green and 7 red balls. Parts (ii)–(iii) are on page 168.
To Find
Complete sample spaces with outcomes identified
Reasoning
Choose what is being recorded and distinguish physical objects when counting equally likely outcomes.
Solution
(i) S = {,,,,,,,,,,,}.
(ii) Including the endpoints: S = {−5,−4,−3,−2,−1,0,1,2,3,4,5}.
If “between” is intended strictly, exclude −5 and 5
the wording does not specify inclusion.
(iii) For recorded colour, S = {green,red}
these are not equally likely.
For uniformly selected individual balls, label them: S = {G1,G2,G3,G4,G5,R1,R2,R3,R4,R5,R6,R7}.
Result
(i) 12 ordered outcomes; (ii) 11 integers inclusively or 9 strictly; (iii) two colour outcomes or 12 individually labelled balls.
Compare the reasoning with your own work. Reading a solution does not record mastery.
Exercise Set 7.3 — Question 3
Printed page 168
In a village fair, there are 3 popular snacks available: Samosa, Pakora, and Bhaji. For drinks, villagers can choose either Chai or Lassi.
(i) List the sample space of all possible snack and drink combinations a person could choose at the fair.
(ii) List the event ‘Selecting Samosa as a snack.’
AIMS worked solution
Given
Choose a snack from Samosa, Pakora, Bhaji and a drink from Chai, Lassi. List S and the event of choosing Samosa.
To Find
All combinations and the Samosa event
Reasoning
Use ordered pairs (snack,drink).
Solution
S = {(Samosa,Chai),(Samosa,Lassi),(Pakora,Chai),(Pakora,Lassi),(Bhaji,Chai),(Bhaji,Lassi)}.
E = {(Samosa,Chai),(Samosa,Lassi)}.
No equal-likelihood claim is needed just to list outcomes.
Result
Six combinations; two belong to the Samosa event.
Compare the reasoning with your own work. Reading a solution does not record mastery.
Exercise Set 7.4 — Question 1
Printed page 169
There are two fruit baskets A and B. Basket A has one apple and two oranges. Basket B has one banana and one mango. You randomly pick one fruit from each basket.
(i) Draw a tree diagram showing all possible pairs of fruits.
(ii) List the sample space.
(iii) What is the probability of picking one apple and one banana?
AIMS worked solution
Given
Basket A has one apple and two oranges; basket B has one banana and one mango. Pick one fruit randomly from each. Give a tree, sample space and P(apple and banana).
To Find
Fruit-pair outcomes and apple–banana probability
Reasoning
Select each physical fruit uniformly; selections from separate baskets are independent.
Solution
Label the oranges O1,O2.
The tree has first branches Apple, O1, O2, each of probability .
Each splits into Banana and Mango, each with probability .
S = {(Apple,Banana),(Apple,Mango),(O1,Banana),(O1,Mango),(O2,Banana),(O2,Mango)}.
The six labelled pairs are equally likely.
P(Apple,Banana) = × = .
If oranges are grouped by type, the four type-pairs are not equally likely.
Result
P(apple and banana) = .
- Apple ·
- Banana ·
- Mango ·
- Orange 1 ·
- Banana ·
- Mango ·
- Orange 2 ·
- Banana ·
- Mango ·
Compare the reasoning with your own work. Reading a solution does not record mastery.
Exercise Set 7.4 — Question 2
Printed page 169
Let us say that you have a box containing 3 red pens, 4 black pens and 2 green pens. You pick a pen (without looking) from the box and put it back. Then your friend does the same.
(i) What are the possible outcomes of the pen colours? Can you draw a tree diagram representing the possible outcomes?
(ii) Can you use the tree diagram to guess the probability that both you and your friend pick pens of the same colour?
AIMS worked solution
Given
A box has 3 red, 4 black and 2 green pens. You select a pen uniformly and replace it; your friend then selects. Give the colour tree and P(same colour).
To Find
Colour-pair sample space and same-colour probability
Reasoning
Replacement restores the original counts for the second selection.
Solution
First branches: R = , B = , G = .
From each branch the second branches again have R = , B = , G = .
Colour pairs: RR,RB,RG,BR,BB,BG,GR,GB,GG.
Their probabilities respectively are ,,,,,,,,.
P(same) = P(RR)+P(BB)+P(GG) = = .
Result
. The nine colour pairs are not equally likely.
- Red ·
- Red ·
- Black ·
- Green ·
- Black ·
- Red ·
- Black ·
- Green ·
- Green ·
- Red ·
- Black ·
- Green ·
Compare the reasoning with your own work. Reading a solution does not record mastery.
End-of-chapter Exercises — Question 1
Printed page 169
Fill in the blanks.
(i) The probability of an impossible event is _______.
(ii) The set of all possible outcomes of a random experiment is called the __________.
(iii) The probability of an event that is certain to happen is _______.
(iv) Tossing a fair coin has a probability of ______ for getting heads.
AIMS worked solution
Given
Fill the blanks: (i) impossible-event probability; (ii) name of the set of all outcomes; (iii) certain-event probability; (iv) fair-coin P(heads). Parts (ii)–(iv) continue on page 170.
To Find
The four missing entries
Reasoning
Definitions of probability, certainty and sample space.
Solution
Impossible events have probability 0
all outcomes form the sample space.
A certain event has probability 1
a fair coin assigns to heads.
Result
(i) 0; (ii) sample space; (iii) 1; (iv) .
Compare the reasoning with your own work. Reading a solution does not record mastery.
End-of-chapter Exercises — Question 2
Printed page 170
In a survey of 50 students, 15 students said they liked football. The number of students who like football is 15, and the ________ (frequency/relative frequency) is __________ (fill in the fraction or decimal).
AIMS worked solution
Given
15 of 50 surveyed students like football. Identify the frequency and relative frequency.
To Find
Count and proportion for football preference
Reasoning
Relative frequency divides the frequency by the sample size.
Solution
The frequency is 15 students.
Relative frequency = = = 0.3.
The source blank requesting a fraction/decimal is therefore “relative frequency”.
Result
Frequency 15; relative frequency or 0.3.
Compare the reasoning with your own work. Reading a solution does not record mastery.
End-of-chapter Exercises — Question 3
Printed page 170
Which of the following experiments have equally likely outcomes? Explain.
(i) A driver attempts to start a car. The car starts or does not start.
(ii) Tossing a fair coin once.
(iii) Rolling a fair 6-sided die.
(iv) Choosing a marble randomly from a bag that contains 3 red marbles and 7 blue marbles.
(v) A baby is born. It is a boy or a girl.
AIMS worked solution
Given
Are outcomes equally likely for (i) a car starting/not starting, (ii) a fair coin, (iii) a fair die, (iv) a random marble from 3 red and 7 blue, (v) a baby being a boy or girl?
To Find
Which stated outcomes justify equal likelihood
Reasoning
Two named possibilities need not each have probability .
Solution
(i) Not established: vehicle condition affects starting probability.
(ii) Yes: fair means P(H) = P(T) = .
(iii) Yes: each fair-die face has probability .
(iv) Colour outcomes are unequal: red, blue.
Individual marbles can be equally likely when uniformly drawn.
(v) Exact equal likelihood is not established merely by naming two outcomes.
A population model or evidence is needed
do not infer an exact from the wording alone.
Result
Equal likelihood is given for (ii) and (iii); it is not justified for the other stated outcome groupings.
Compare the reasoning with your own work. Reading a solution does not record mastery.
End-of-chapter Exercises — Question 4
Printed page 170
Write the sample space and calculate the probability based on the given information.
(i) Two coins are tossed at the same time. What is the probability of getting at least one head?
(ii) Ten identical cards numbered 1 to 10 are placed in a box. One card is drawn at random. What is the probability of drawing a card with an even number?
(iii) A die is rolled once. What is the probability of getting a number greater than 4?
(iv) A bag contains 3 red balls, 2 blue balls, and 1 green ball. One ball is picked at random. What is the probability that it is not red?
(v) Three coins are tossed simultaneously. What is the probability of getting exactly two heads?
AIMS worked solution
Given
Give S and the requested probability: (i) at least one head with two coins; (ii) even card from 1–10; (iii) die greater than 4; (iv) not red in a bag of 3 red,2 blue,1 green; (v) exactly two heads with three coins.
To Find
Five sample spaces and event probabilities
Reasoning
For coin and die calculations assume fair independent trials; select individual cards/balls uniformly.
Solution
(i) S = {HH,HT,TH,TT}
E = {HH,HT,TH}
P = .
(ii) S = {1,2,3,4,5,6,7,8,9,10}
E = {2,4,6,8,10}
P = = .
(iii) S = {1,2,3,4,5,6}
E = {5,6}
P = = .
(iv) S = {R1,R2,R3,B1,B2,G1}
E = {B1,B2,G1}
P = = .
(v) S = {HHH,HHT,HTH,HTT,THH,THT,TTH,TTT}
E = {HHT,HTH,THH}
P = .
Result
(i) ; (ii) ; (iii) ; (iv) ; (v) , under the stated models.
Compare the reasoning with your own work. Reading a solution does not record mastery.
End-of-chapter Exercises — Question 5
Printed page 170
A bag has 3 candies: strawberry, lemon, and mint. One is picked at random. What is the probability of picking a strawberry candy?
AIMS worked solution
Given
Select one of three candies—strawberry, lemon and mint—uniformly at random.
To Find
Probability of selecting strawberry
Reasoning
One favourable candy among three equally selectable candies.
Solution
S = {strawberry,lemon,mint}.
The strawberry event has one outcome.
P = .
Result
.
Compare the reasoning with your own work. Reading a solution does not record mastery.
End-of-chapter Exercises — Question 6
Printed page 171
A child has 2 shirts (one red and one blue) and 3 types of pants (jeans, khakis, and shorts). List all the possible combinations of outfits consisting of one shirt and one pair of pants. Display your answer in a table format.
AIMS worked solution
Given
Choose a red or blue shirt and jeans, khakis or shorts. List all outfits in a table.
To Find
All shirt–pants combinations
Reasoning
For each of two shirts there are three pants choices.
Solution
Red shirt: jeans
khakis
shorts.
Blue shirt: jeans
khakis
shorts.
Every row choice of shirt can pair with every column choice of pants, so there are 2 × 3 = 6 outfits.
Result
(Red,jeans), (Red,khakis), (Red,shorts), (Blue,jeans), (Blue,khakis), (Blue,shorts).
| Shirt | Jeans | Khakis | Shorts |
|---|---|---|---|
| Red | Red + jeans | Red + khakis | Red + shorts |
| Blue | Blue + jeans | Blue + khakis | Blue + shorts |
Compare the reasoning with your own work. Reading a solution does not record mastery.
End-of-chapter Exercises — Question 7
Printed page 171
A tyre company records distances before replacement in 1000 cases. Distance (km) Less than 4000 4001 to 9000 9001 to 14000 More than 14000 Number of cases 20 210 325 445 Find the probability that a randomly chosen tyre lasts:
(i) Less than 4000 km.
(ii) Between 4000 and 14000 km.
(iii) More than 14000 km.
AIMS worked solution
Given
Among 1000 tyres, recorded counts are: below 4000 km:20; 4001–9000:210; 9001–14000:325; above 14000:445. Estimate P(i) below 4000, (ii) between 4000 and 14000, (iii) above 14000.
To Find
Three probabilities from recorded frequencies
Reasoning
Use the supplied table bins as recorded; these are empirical estimates.
Solution
(i) = .
(ii) Combining the two middle bins: = = .
(iii) = .
The printed bins leave the exact 4000 boundary unstated.
The middle-bin answer follows the table’s grouping
no extra observation at that boundary is invented.
Result
(i) ; (ii) from the middle bins; (iii) .
Compare the reasoning with your own work. Reading a solution does not record mastery.
End-of-chapter Exercises — Question 8
Printed page 171
The letters of the word ‘PEACE’ are placed on cards. Leela draws a card without looking.
(i) What is the probability that it is a P, E or C?
(ii) What is the probability that it is not an E?
AIMS worked solution
Given
Choose one of the five PEACE letter cards uniformly. Find (i) P, E or C, and (ii) not E.
To Find
Probabilities for the specified letter events
Reasoning
Distinguish the two physical E cards.
Solution
S = {P,E1,A,C,E2}, with five equally likely cards.
For the event “P or E or C”, favourable cards are P,E1,C,E2, giving .
If separate letter probabilities are requested, P(P) = , P(E) = and P(C) = .
Not E comprises P,A,C, so P(not E) = = 1.
Result
(i) Union event ; individual P,E,C probabilities ,,. (ii) .
Compare the reasoning with your own work. Reading a solution does not record mastery.